MassQC
review
Quality in Proteomics?
The question above piqued our curiosity to review MassQC.
Before jumping into the review we should go over what most people do to
assure themselves that their mass spectrometers are working properly. Most call this test a system
suitability test, Proteome Software calls this a QC run.
Intro
We will go through a QC intro because we know that the
concept of a QC run in proteomics will be foreign to some.
Let's assume that you are a mass spectromitrist and you
routinely perform protein ID, and more complex proteomic experiments like
MudPIT. Your clients or coworkers trust that you will do a good
job and handle their samples with care. From the research side it will
often take an
extraordinary amount of resources, and research time to come up with a
sample for proteomic analysis. As analysts we understand valuable
samples cannot be shot down the drain with a shrug of the shoulders.
Typically we run a QC run before and after the sample set so that we
can say our instrument was working before and after the samples ran.
We do this to protect ourselves, and to defend our lab, but more
importantly we do it to
protect our client's precious samples.
For system suitability, some of us would do a
QC run on our
LC/MS system using a typtic digest of a standard protein. Before
starting our LC/MS analysis we would inject a digest of a standard
protein of known concentration, usually a BSA or a myoglobin digest.
At IonSource we prefer horse myoglobin tryptic digest as our standard, because there is no
need to reduce and akylate the cysteines before performing the digest. As you might be able to tell
we like to make our own
standard digest. Also, the myoglobin tryptic digest produces fewer peptides than
the BSA digest,
which allows us to become more intimate with the peptides that we
observe.
Our QC run at IonSource goes something like this, we inject 10 fmol of
myoglobin tryptic digest, and run a short 30 minute gradient, and then look
to see if our peptides appear in the base peak chromatogram. We
would also look at the peak intensity as a gauge of our performance and sensitivity. Then we
would submit the QC data file for database searching. If the search
returns with a result for horse myoglobin with 40% sequence coverage, or
better, then we say that we passed our system suitability.
We run a post run QC after the sample set, and we pray that we pass. It
is important that we pass our post run QC, because how could we charge
our client if we could not say our instrument was still operating after
their samples ran. If you are submitting samples to a CRO
(contract research organization) we would suggest that you obtain all of
your raw data for archival and request that a QC is run before and after
your sample set, request the QC raw files also.
Basically our criteria for passing the system suitability
test was protein sequence coverage and peak intensity. The only real hard, hands off , metric was
percent sequence
coverage of the correct protein in a database search. It was not a bad test, and gave us reasonable assurance
that everything was working OK. Our simple test is much better than what
most other labs do. Most other labs virtually do nothing before shooting
your precious samples,
saying, "Well, it was working, until we got to your stupid samples!
What did you put in there?" If I were the client I would say,
"Prove it! Prove to me that your stupid instrument was working, or
we are not going to pay you!"
The Review
MassQC
Program Functional Review
MassQC evaluates QC runs with a battery of
metrics that far exceeds our short glance at system suitability as described above.
First of all MassQC is a server side application.
We never thought that we would like this software model, but MassQC works
seamlessly. It's nice having a program on a server maintained by
professionals. Version updates are taken care of by Proteome
Software, and there is none of this, "Will it work with windows 7? Do
I need to run 64 bit Windows XP? What do you mean I need to run
Linux? What do you mean I need to install .net." All of that's nonsense is gone, and thank goodness.
MassQC is set up as a subscription based software
package. For a low monthly rate you can gain access to the resource.
At $60/mo it is a bargain. Imagine if you could access Mascot for
$60 month and never had to troubleshoot the program, or need to
maintain databases. That would be a dream come true, wouldn't it?
We understand that some private companies, drug companies, don't like
sending sensitive data over the internet, and we have been told that a
client side version of MassQC is coming soon. However, we would
argue that a myoglobin digest raw file sent over the internet is not a
sensitive piece of data.
We will be evaluating the trial version which is the
same as the fully licensed version. The free trial version is good
for 30 days. At the end of the 30 day period we found that we
began to rely on it. The one caveat for the demo is that you need 25 QC runs
"in the
can" in order for it to start doing its statistical analysis. Then
with each subsequent upload MassQC runs an analysis, and tells you how the
most recent run compares with the previous runs. If you only run one QC
a day, you will soon be at the end of your trial before you can get to
the fun stuff. When you are doing your demo you can always go back into your log, and pull out
old QCs and load them, but it is a bit of a pain to go hunting for them. We
have made some suggestions to Proteome Software to extend their trial period or
reduce the number required runs. However, we understand the statistical
significance argument as well. We have some indications that MassQC is
addressing this issue, perhaps by allowing the client to see the metrics
page before the metrics become entirely significant.
If you go to MassQC.com this is what the intro page looks like.
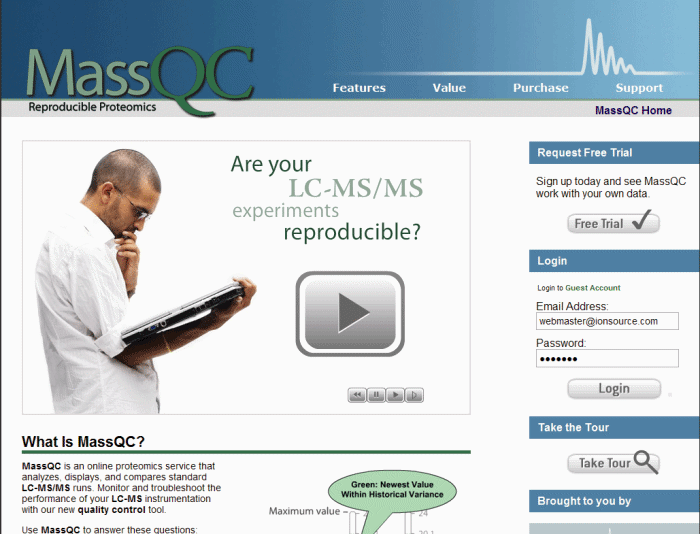
When you visit the website click on the "Free Trial" button. The sign up
is pretty nonintrusive, which we liked a lot. There is not really a
marketing component to the signup, and you don't need to give up any
private information to get going, which is really cool.
Of course once MassQC sales see this review they will say, "Why
aren't we gathering more marketing info?" The software is
very intuitive. Personally I hate to read instructions and I often go off
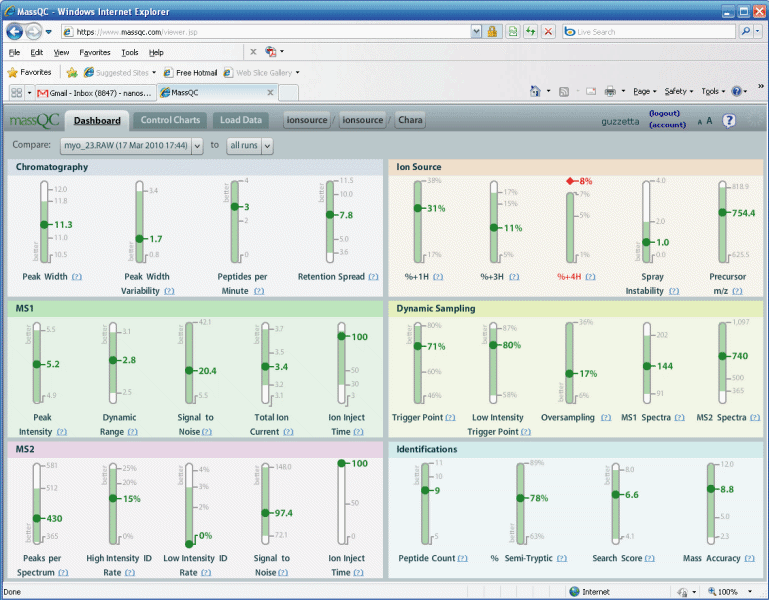
and just try new programs, and get into trouble, but not with MassQC. The MassQC interface was very intuitive. However,
when the results come up there are a lot
of metrics to take in, and at first it can be confusing, see figure
2 below. There are 28
metrics, wow! Actually the documentation for each of the
metrics is spelled out in detail. You will notice a blue
question mark at the bottom of each metric. By clicking on the
question mark you will be taken to an in depth description of the
metric, see below. First, if you have a question, click on the
question mark, and don't mail Proteome Software or IonSource.
We are guilty of this, mailing Proteome Software asking, "What is this what is
that?" The descriptions
provided online are very good.
Figure 2.
Here we will click on the question mark for peak
width, and here is what pops up, see figure 3.
Figure 3.
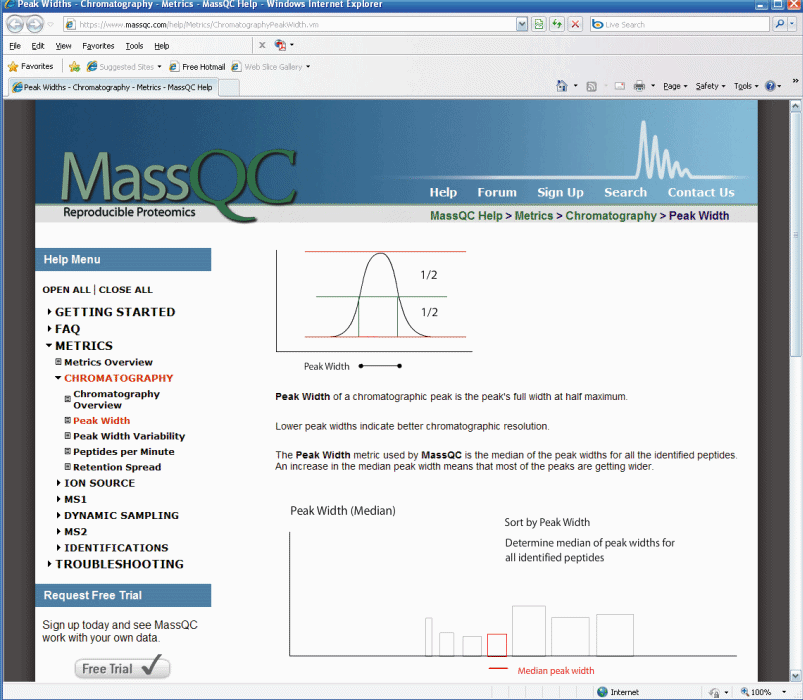
This is only part of the explanation for the peak width
query,
if you scroll down on the peak width page it tells you how to troubleshoot bad
peak shape. The help section of MassQC is extraordinary.
They have spent a lot of time making every aspect of MassQC crystal clear.
Our first impression of the dashboard, as shown in
figure 2, was that we
were overwhelmed. It is a far cry from, "Oh, yeah pretty peaks",
and 42% sequence coverage. We began to ask are there too many
metrics, do we need them all? Do we really need to know the
percent of +4 ions? It reminded us of an airplane cockpit
dashboard. While every gauge may be necessary, it might be
nice to filter some of the information. For example when we get
into our cars we want to know how fast we are going, how much gas we have,
and is our engine overheating. If we are doing our weekly
maintenance or take the car into a garage we might like to know how much wear is on
our brake pads or what our compression is. So at
first it was information overload. Our usual metrics were mixed in
with all of these other metrics that we had never considered before.
In short we would like to be able to know everything, but in a
functional light we would like to be able to filter. My guess
is that this program will make us all better mass spectromitrists.
There is an option to filter multiple trend lines in
the control charts section of MassQC. Trending is an aspect
where MassQC excels. It is valuable to be able to go back ands
see how parameters change over time, see figure 4.
Figure 4.
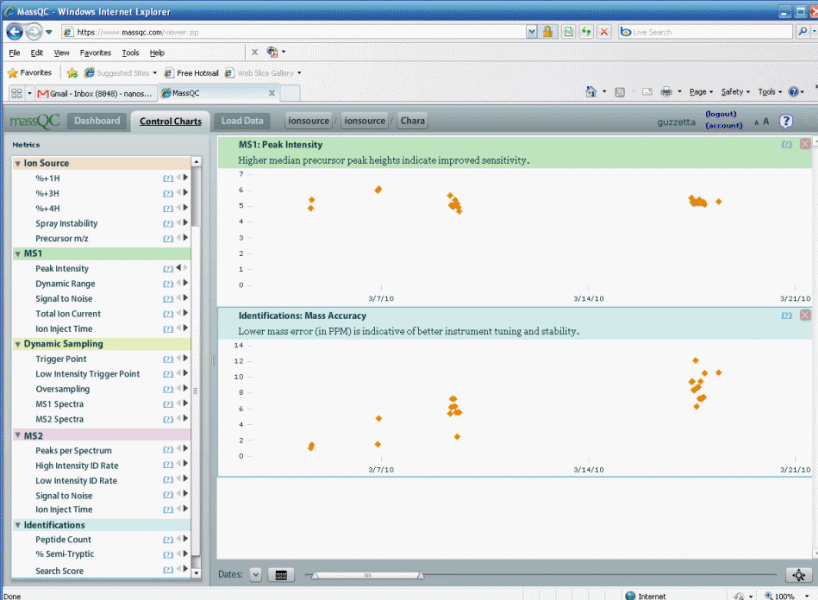
The control charts provided by MassQC allow you to see
how your instrument is changing over time. You can definitely see
in figure 4 above that our mass calibration has drifted from 1 ppm to 10
ppm over the course of two weeks; how embarrassing. Our peak
intensity has stayed pretty much the same. The control charts
functionality is definitely a function that we have not had in the past,
but it is one that we can see being very valuable. Before MassQC
we
would always think, "Our maps looked better in the past than they do now,
or are we remembering wrong?" Things were always better in the
past, weren't they? If we had been running MassQC there
would be no doubt, and we would have all the historical data we need.
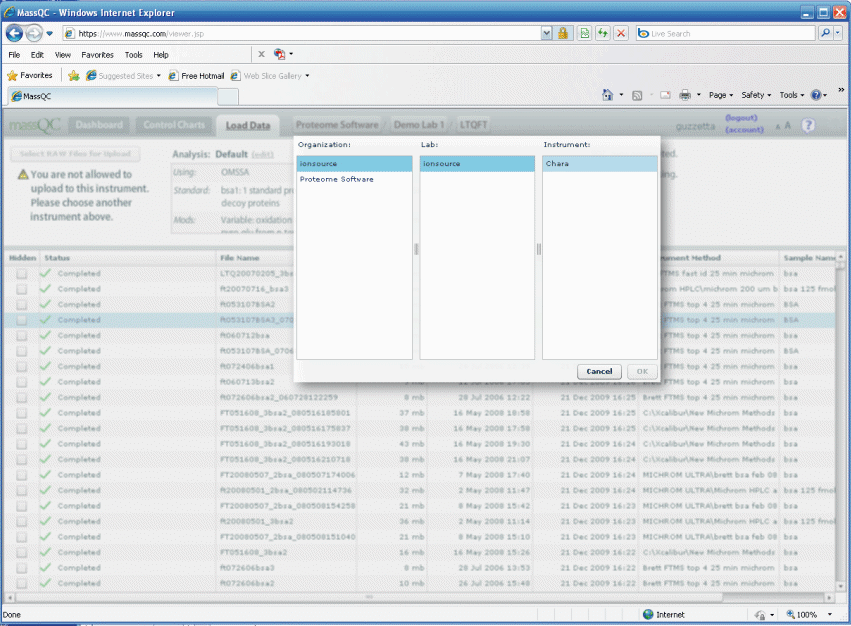
It looks like we skipped over how you load data, so we will
do that now. It is very simple. First of all you go to MassQC.com and log onto the
account you created. Then click on the load tab and choose your
instrument. My instrument is called Chara. See figure 5
below.
Figure 5.
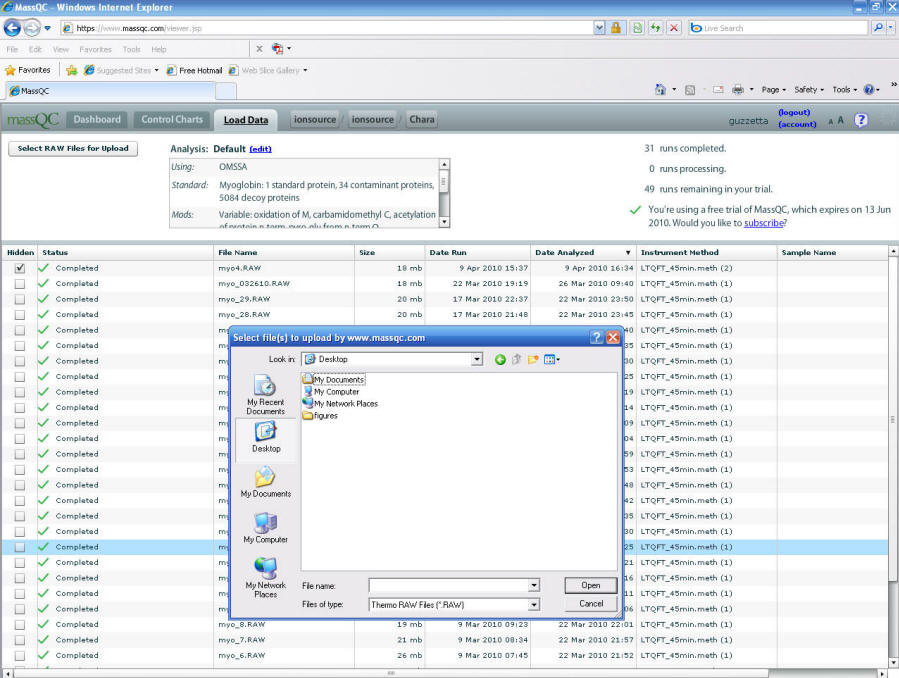
Once you are logged in browse to your QC raw file on
your local computer, see figure 6 below. It is too simple.
Figure 6.
Once the new QC raw file is loaded your metrics will be
displayed. The entire loading and analysis process will take only a few minutes.
Figure 6.
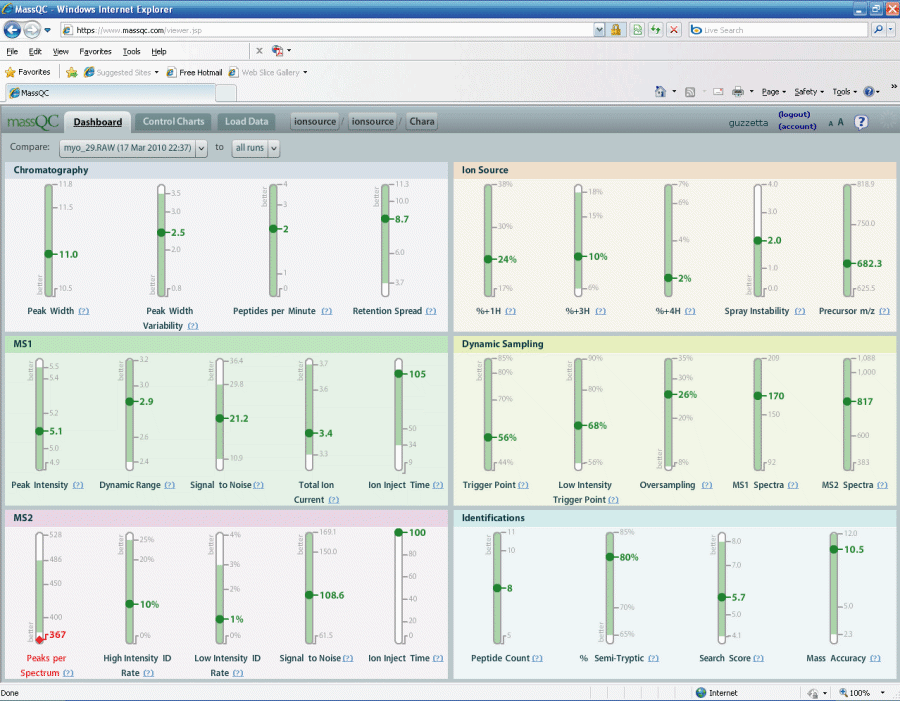
Most of the metrics are green. We are identifying
eight
peptides in our simple myoglobin QC, which is acceptable to us. MS2 peaks
per spectrum is a bit low but I am not worried too much since we are
identifying our peptides of interest. For this one red metric I
might interpret it as I am seeing less noise and more peaks of interest.
I might be tempted to say that this one red metric is useless; however,
in another circumstance it might be relevant. For example if we had
two peptide IDs we might look over at the peaks per spectrum metric to see
what that number is. MassQC begins to let you diagnose your
instrument related problems in a scientific manner.
Conclusion:
MassQC is really the first program that addresses
quality control in proteomics. MassQC addresses an obvious need,
just as Scaffold was the
first program to address being able to compare multiple proteomic runs
side by side. MassQC allows an analyst to evaluate an instruments
performance, and whether it is fit to run samples. MassQC also allows a
lab manager to monitor the performance of all of the instruments
in the lab from his or her office. Now a manager can call his
assistant to say, "Hey Alice what the heck is going on with LTQ #5, and
why the heck did you just load samples?" At IonSource if we are
ever in a position to submit samples to a CRO we will ask if they use MassQC,
or we will ask them how they pass their system suitability test, and
then we will ask them for their system suitability SOP. Data
quality is also very important in publishing scientific articles.
It would be nice to be able to put a line in the papers methods section like, "Samples were run under these conditions following the
run of a QC sample evaluated by the program MassQC passing these
metrics."
Program Enhancement or Suggestions: We would like
to be able to filter the metrics into two pages, for example a primary
metric page, and a secondary metric page. This way we could
reflect our SOP system suitability metrics on the primary page and
relegate all of those that may confuse a client to the secondary page.
We would also like to see a base peak representation of the mass
chromatogram. Our dream would be to be able generate a "Passed QC"
page that would contain our primary metrics and a representation of the
base peak mass chromatogram. This would be our QC certificate of
analysis that we could provide to our clients along with their data to
show that we did our part to insure the quality of our analysis.
We suggest you try MassQC, and check out
the free trial.
Andrew Guzzetta
IonSource
Links:
-
NIST: Performance Metrics for Proteomics
-
How MassQC
works
-
MassQC
users forum
-
Make your own myoglobin digest
-
Horse
apomyoglobin as a system suitability standard.
e-mail the webmaster@ionsource.com
with all inquiries
home
| terms of use
(disclaimer)
Copyright © 2010 IonSource, LLC All rights reserved.
Last updated:
Wednesday, October 06, 2010 11:23:27 AM
|