|
|
Introduction to MS Quantitation
|
| Introduction |
|
This tutorial applies to the quantitation of small molecules using mass spectrometry in pharmacokinetic analysis. In addition these very same principles can be applied to the quantitation of peptides and proteins in biological matrices. Traditionally before the advent of modern-day mass spectrometry quantitation was accomplished using HPLC and UV detection. HPLC PK analysis relied on: retention time, peak area and UV spectral character. Unfortunately the HPLC assay suffered from lack of sensitivity and specificity. We have seen examples where a molecule was extensively metabolized and yet the retention time and UV spectral character remained the same as the parent compound. This lack of specificity will from time to time mislead the investigator. MS characterization is now a vital new tool in pharmacokinetic analysis. The accepted way of performing mass spec quantitation is by using a mass spectrometer capable of MS/MS fragmentation. MS/MS used in conjunction with quantitation is commonly accomplished with a triple quadrupole or ion trap mass spectrometer. The reason MS/MS is required is because many compounds have the same intact mass. While many researchers use the first dimension of MS to perform quantitation, that technique again suffers from lack of specificity, especially in very complex matrices like blood. The second dimension of MS fragmentation in the majority of cases provides a unique fragment. The combination of the specific parent mass and the unique fragment ion is used to selectively monitor for the compound to be quantified. Below we will discuss the method for acquiring and visualizing LC/MS data.
|
|
Modes of acquiring and visualizing LC/MS data,
or how MS data is represented in an LC/MS run.
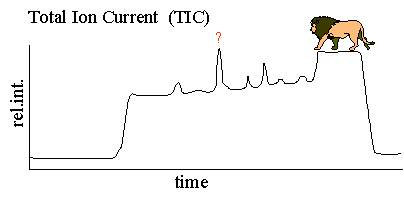
Typically the mass spectrometer is set to scan a specific mass range. This mass scan can be wide as in the full scan analysis or can be very narrow as in selected ion monitoring. A single mass scan can take anywhere from 10 ms to 1 s depending on the type of scan. Many scans are acquired during an LC/MS analysis. LC/MS data is represented by adding up the ion current in the individual mass scans and plotting that "totaled" ion current as an intensity point against time. The resulting plot is a plot that looks very much like an HPLC UV trace, see Figure 1 below. Below we will discuss the modes of scanning and acquiring MS data and their relevance to MS quantitation.
|
|
The most common modes of acquiring LC/MS data are
: (1) Full scan acquisition resulting in the typical total ion current plot (TIC) (2) Selected Ion Monitoring (SIM) (3) Selected Reaction Monitoring (SRM) or multiple reaction monitoring (MRM). MRM and SRM are essentially the same experiment. |
|
Full Scan Analysis
|
|
Figure 1
|
|
The total ion current full mass range plot from a PK analysis is a wild place. The MS total ion current plot is a plot much like an HPLC UV trace except for the fact that the mass spectrometer can detect many more components, UV transparent components. The total ion current is a plot of the total ion current in each MS scan plotted as an intensity point. As a small molecule or peptide elutes from the HPLC column the relative intensity goes up and a peak appears in the total ion current plot as the points (TIC of each scan) are plotted against time. Compounds of every mass are plotted in the TIC plot above . Finding the compound of interest can be difficult since many compounds have the same mass. The intact mass of a compound is not a unique identifier. Using the data set above, a specific mass can be selectively plotted, however the sensitivity will be less than what is observed in the SIM experiment described below.
|
| (Note: The term
TIC refers to graph of mass scan data collected over time and does not
specify a scan mass range or a type of MS experiment. For example
one could have a TIC plot of a SIM or SRM experiment. However, to
simplify matters we will be referring to these plots as SIM and SRM
plots respectively rather than for example SIM TIC plots.)
|
| Selected Ion Monitoring (SIM) |
|
|
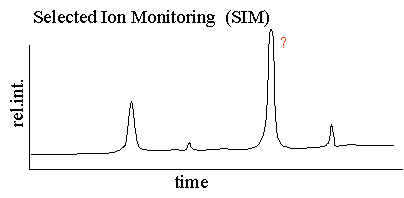
| In selected ion monitoring
the mass spectrometer is set to scan over a very small mass range,
typically one mass unit. The narrower the mass range the more
specific the SIM assay. The SIM plot is a plot of the ion current
resulting from this very small mass range. Only compounds with the
selected mass are detected and plotted. The plots in Figures 1 and
2 can be from the very same sample however the plots look very
different. The reason for this is because the peaks seen in the
SIM plot may only be very minor components in the TIC plot above. The SIM plot is a more
specific plot than the full scan TIC plot.
Figure 2
Still, the SIM plot shows a number of peaks leaving us without a unique identifier for our compound. This is typical for a SIM plot of a very complicated sample, like a serum or plasma sample. Many compounds have the same mass and in electrospray where there are multiply charged species the likelihood is even higher for compounds having the same m/z value. The SIM experiment is more sensitive than the full scan experiment because the the mass spectrometer can dwell for a longer time over a smaller mass range.
|
| Multiple Reaction Monitoring (MRM) also called Selected Reaction Monitoring (SRM) |
|
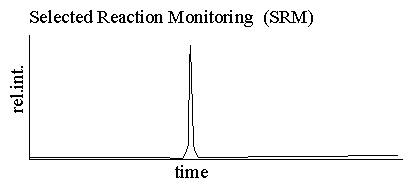
Multiple
reaction monitoring is the method used by the majority of scientists
performing mass spectrometric quantitation, see Figure 3. MRM
delivers a unique fragment ion that can be monitored and quantified in
the midst of a very complicated matrix. SRM plots are very
simple, usually containing only a single peak. This
characteristic makes the MRM plot ideal for sensitive and specific
quantitation.
|
|
Figure 3
|
|
The MRM experiment is accomplished by specifying the parent mass of the compound for MS/MS fragmentation and then specifically monitoring for a single fragment ion. One could think of this operation as the SIM of a fragment ion. The specific experiment in known as a "transition" and can be written (parent mass -> fragment mass) For example 534->375. |
|
|
|
|
|
home
| disclaimer |