|
|
|
|
Isotopes |
|
|
Slide 5 |
|
|
Peak Abundance, "Crossover Mass" and Calibration |
|
| . | |
| . | |
|
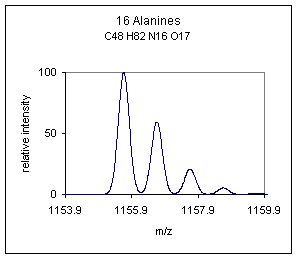
Below are six simulated mass spectrums demonstrating how the ratio of the isotopes change with increasing mass and how baseline separation of the peaks change across the mass range while resolution is maintained. Poly-Alanine peptides are used to demonstrate these principles. |
|
| . | |
|
|
|
| With the standard quadrupole based mass spectrometer baseline resolution of the isotopes is difficult to maintain with increasing mass. The six spectrums above demonstrate this principle. With the standard quadrupole based mass spectrometer resolution of the isotopes begins to disappear somewhere between 2500 and 4000 amu. It is also interesting to note that the A+1 isotope starts to "crossover" in abundance some where between 1700 and 2000 amu. By crossover we mean that the A+1 peak begins to supplant the "A" peak as the most abundant. This fact is relevant to mass spectrometer calibration, if the mono isotope is selected for calibration at mass 1800 the mass spectrometer may pick the A+1 isotope because it is higher. If the quality of the spectrum is not all that great the "A" and the A+1 isotope may actually bounce back and forth in abundance from scan to scan. If you have an automated calibration procedure it pays to watch it when it gets to these difficult masses. If the program picks the wrong peak this is will throw off the calibration. | |
|
.
|
|
Next  |
|
|
. |
|
|
.(slide jumper) Contents Glossary Comp. 1 2 3 4 5 6 7 8 - |
|
|
home
| disclaimer |
|


