|
Advertisement |
||
|
|
||
|
|
||
| - | ||
|
- De Novo Peptide Sequencing Tutorial Example Spectrum part three, high mass |
||
|
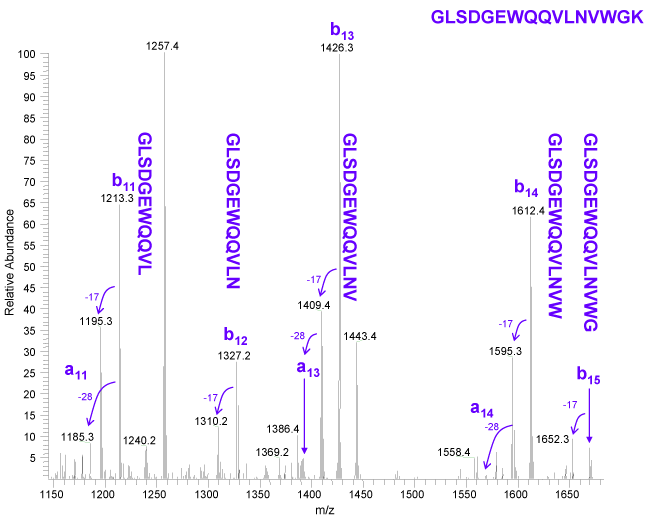
At the high end of the spectrum, the b ions increase dramatically in intensity as compared to the b ion intensity at the low end of the spectrum. In addition, y ion intensity has greatly decreased. It is as if the y and b ion intensity have swapped.
|
||
| Figure 1. | ||
|
|
||
|
|
||
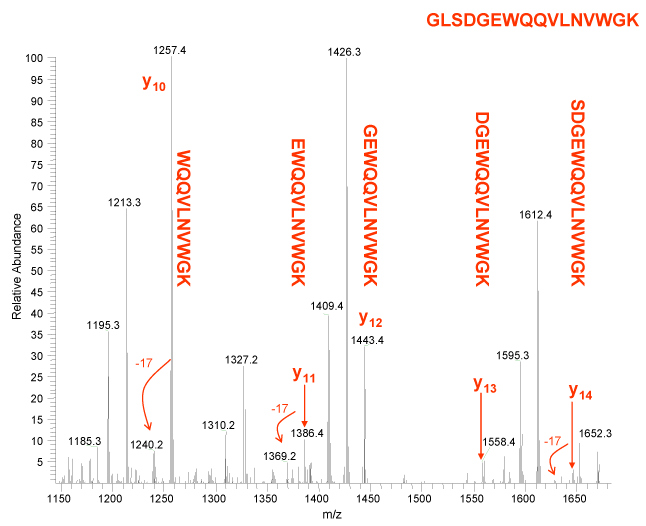
| Figure 2. | ||
|
|
||
| Figure 2 shows the greatly diminished y ion intensity at the high end of the spectrum. This occurs as we encounter an E. The reduction in peak intensity is pretty dramatic. Out of curiosity we plotted the pIs of the y and b ions, take a look. Amazing, between the y and b ion coverage we have accounted for almost all of the major peaks. | ||
|
Feeling pretty bold? Proceed on to the next page for a true de novo example.
|
||

|

|
|
| back | forward | |
|
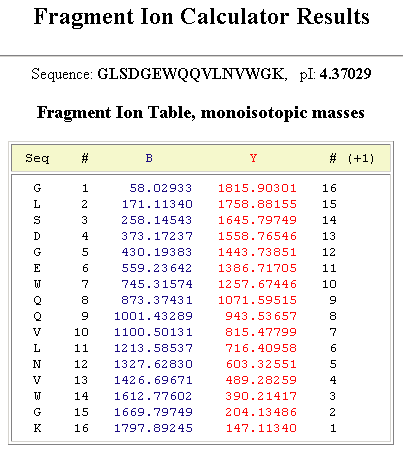
Reference Figuresb and y Ion Table
|
||
|
|
||
|
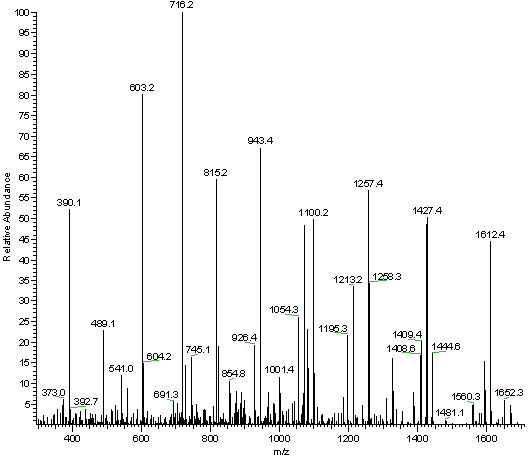
Full Fragment Spectrum
|
||
|
|
||
|
|
||
|
|
||
| e-mail the webmaster@ionsource.com with all inquiries | ||
| home
| terms of use
(disclaimer) Copyright � 2012 IonSource All rights reserved. Last updated: Monday, February 01, 2016 11:04:59 AM |
||
|
|
||


