| Notice: IonSource | ||
|
Advertisement |
||
|---|---|---|
|
|
||
|
` |
||
|
- |
||
|
- De Novo Peptide Sequencing Tutorial Example Spectrum part two, mid mass |
||
|
|
||
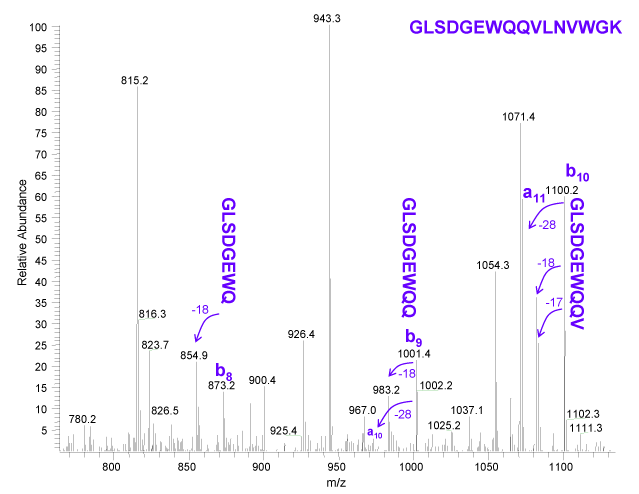
| As we move into the mid spectrum
range the intensity of the b ions increase, see Figure 1 below. The b
ions in Figure 1 are losing water and ammonia which is consistent with S
(-18) and Q (-17) residues. Peaks consistent with a ions are
also observed at -28u from two of the b ions.
Figure 1. |
||
|
|
||
|
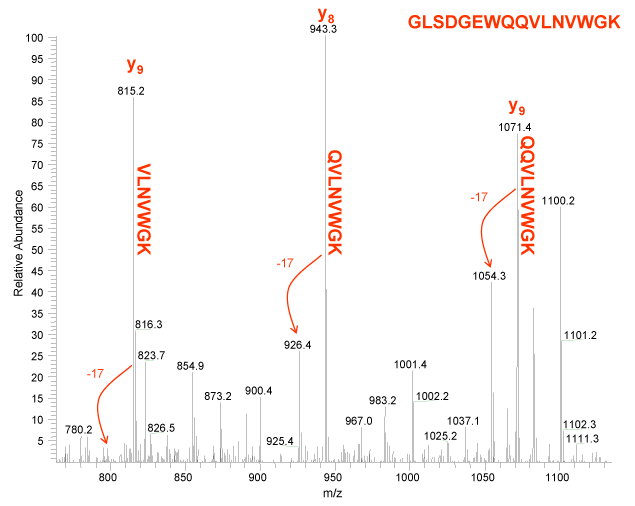
The predominant ion in the mid range is the y ion. Notice that only ammonia loss (-17) is noted for the y ions in Figure 2. The -17u loss is consistent for fragments containing the residues K, Q and N. Also note that the greatest ammonia loss is observed for fragment y9 which contains the greatest number of these residues. Figure 2.
|
||
|
Shall we proceed onto the high mass range of the spectrum? Let's.
|
||

|

|
|
| back | forward | |
|
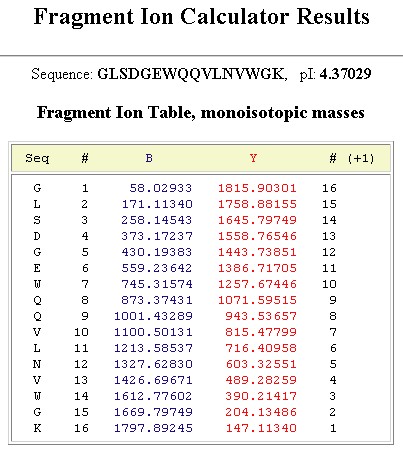
Reference Figuresb and y Ion Table
|
||
|
|
||
|
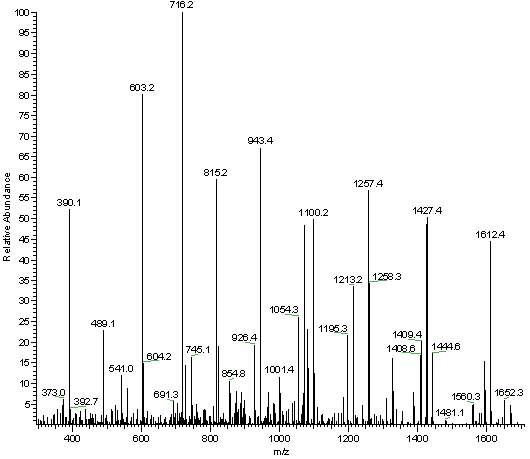
Full Fragment Spectrum
|
||
|
|
||
|
|
||
|
|
||
|
|
||
| e-mail the webmaster@ionsource.com with all inquiries | ||
| home
| terms of use
(disclaimer) Copyright � 2012 IonSource All rights reserved. Last updated: Monday, February 01, 2016 11:04:38 AM |
||
|
|
||


