|
Notice: IonSource |
||
|
Advertisement
|
||
|
` |
||
|
|
||
|
- De Novo Peptide Sequencing Tutorial pI plotting |
||
|
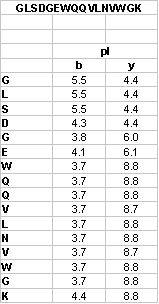
This table was generated using the ExPASy "Compute pI/Mw tool" http://www.expasy.org/tools/pi_tool.html
|
||
|
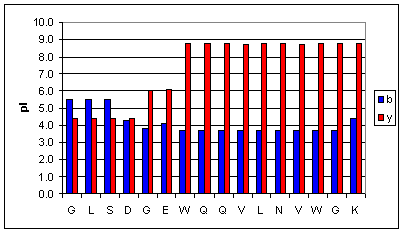
Here is the pI graph generated from the table above. |
||
|
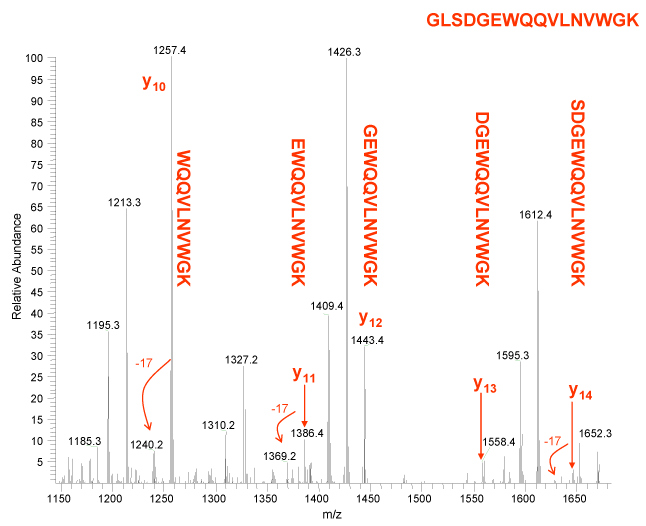
Notice the y ion intensity takes a hit when we encounter glutamic acid, going from y10 to y11 and then again when we cross aspartic acid going from y13. |
||
|
|
||
|
|
||

|

|
|
| back | forward | |
|
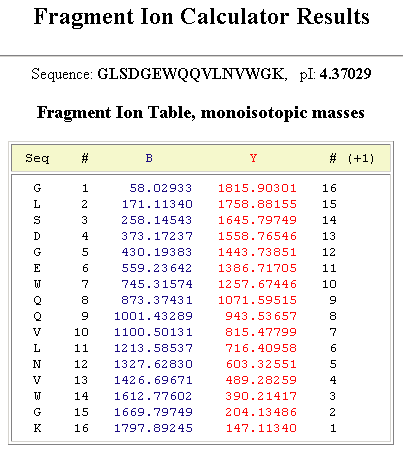
Reference Figuresb and y Ion Table
|
||
|
This table was generated using the ISB tool,
|
||
|
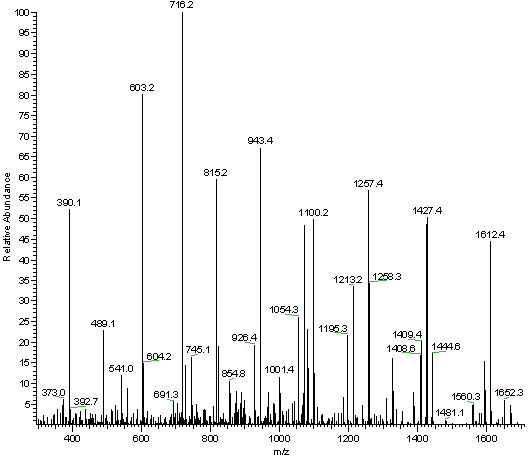
Full Fragment Spectrum
|
||
|
|
||
|
|
||
|
|
||
| e-mail the webmaster@ionsource.com with all inquiries | ||
| home
| terms of use
(disclaimer) Copyright � 2012 IonSource All rights reserved. Last updated: Monday, February 01, 2016 11:04:25 AM |
||
|
|
||

