|
|
|
|
"Isotopes" |
|
|
Slide 7 |
|
|
Mass Assignment and Centroiding |
|
| . | |
| - | |
|
This section of the tutorial explains how mass and resolution affects mass labeling and could possibly explain the delta masses observed between observed and expected mass. It all depends on what you expect and how your mass labeling software behaves. At low mass the "A" peak (monoisotopic peak), will dominate and at higher mass the largest isotope will be closer to the average mass of the compound. The spectra bellow will illustrate some of these general principles and we will attempt to explore some of the common mass labeling problems. |
|
| -- | |
| - | |
| - | |
| Figure A
|
Figure B
|
| - | - |
| - | - |
|
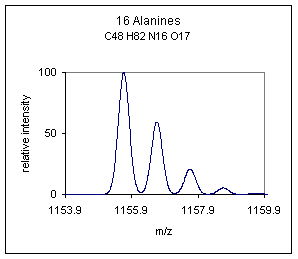
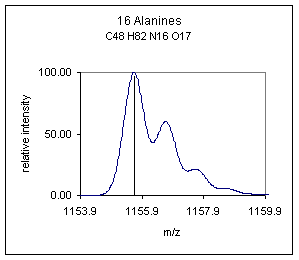
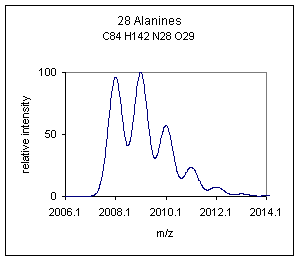
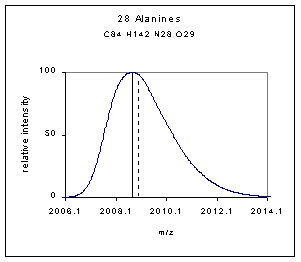
When operating a mass spectrometer at lower resolution (normal for LC/MS) an isotopic display, as illustrated in Figure A, may look like the spectrum shown in Figure B. The monoisotopic peak is still identifiable. Peak labeling software will most likely pick the peak top of the monoisotpoic peak in Figure B and label this as the mass. Most MS software will have difficulty centroiding the cluster in Figure B to deliver a mass that is near to the average mass. One may presume that the mass delivered by most mass labeling software will be closer to the monoisotopic mass when the peak is below ~1700 amu. Each operator should investigate how their software behaves. Some labeling software is quite flexible, allowing the operator to modify the centroiding parameters. |
|
| - | - |
| - | - |
| - | - |
|
Figure C
|
Figure D
|
| - | - |
| - | - |
|
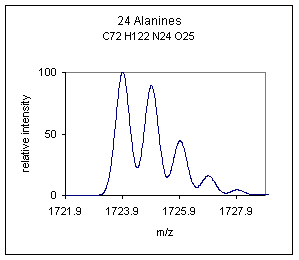
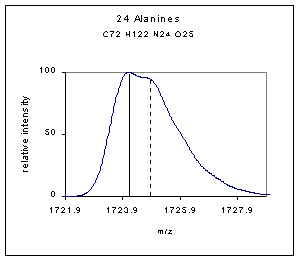
In Figure C the A+1 peak is close in abundance to the monoisotopic peak, ("A" peak). Figure D illustrates the difficulty encountered at what we like to call the crossover mass. The crossover mass occurs when the A+1 peak is competing with the "A" peak for base peak status. If the mass assignment software is just a peak top picking utility then the mass assignment for Figure D (solid line) may be significantly different than the peak centroid (dashed line). |
|
| -- | - |
| - | - |
| - | - |
| Figure E
|
Figure F
|
| - | - |
| - | - |
| Figure E shows an isotopic display where the A+1 peak is in greater abundance than the "A" peak. Figure F illustrates how the local maximum, (solid line), intensity moves closer to the centroid, (dashed line), of the merged cluster. At higher masses the peak top will essentially be very close to the centroid and average mass eliminating some discrepancies between mass labeling software. | |
| - | |
| Labeling Conclusion: The easy take home points are, at low mass (<700 amu) the local maximum in an isotopic display will be close to the monoisotopic mass. At masses above 2000 amu the local maximum will shift to be closer in agreement with the average mass of the compound. Mass labeling software may have difficulty with masses between 1000 and 2000 amu depending on the softwares centroiding capabilities. | |
|
-. |
|
|
- |
|
 Previous Previous
|
Next |
|
.(slide jumper) Contents Glossary Comp. 1 2 3 4 5 6 7 8 - |
|
|
home
| disclaimer |
|
